Market data
Read an artist page and a venue page
Every artist and every venue in Eventory has a page. The artist page gathers the audience behind the demand: Spotify, Instagram, TikTok and YouTube figures, demographics, latest releases, Eventory's scores and the artist's events with their sales. The venue page gathers the building: capacity, the seat map, which sections sell on resale, the resale rate and price range per event, and the hours and days its tickets move. Both are open; the advanced artist data needs Market Intelligence.
Before you start
- Nothing for the public parts. Market Intelligence for the advanced artist data.
Steps
Open an artist page
Click the artist's name on any event page, or search for the artist and switch the results to Artists. The page opens on the Overview tab, with Events and Advanced Data beside it, and Track adds a monitor on the artist.
Artist Info shows the biography, location, gender and birthday where known. Below it, Social Platforms lists Spotify, Instagram, TikTok and YouTube with the current figures, and Latest Releases the recent records, because a release date is often the reason a tour is announced.
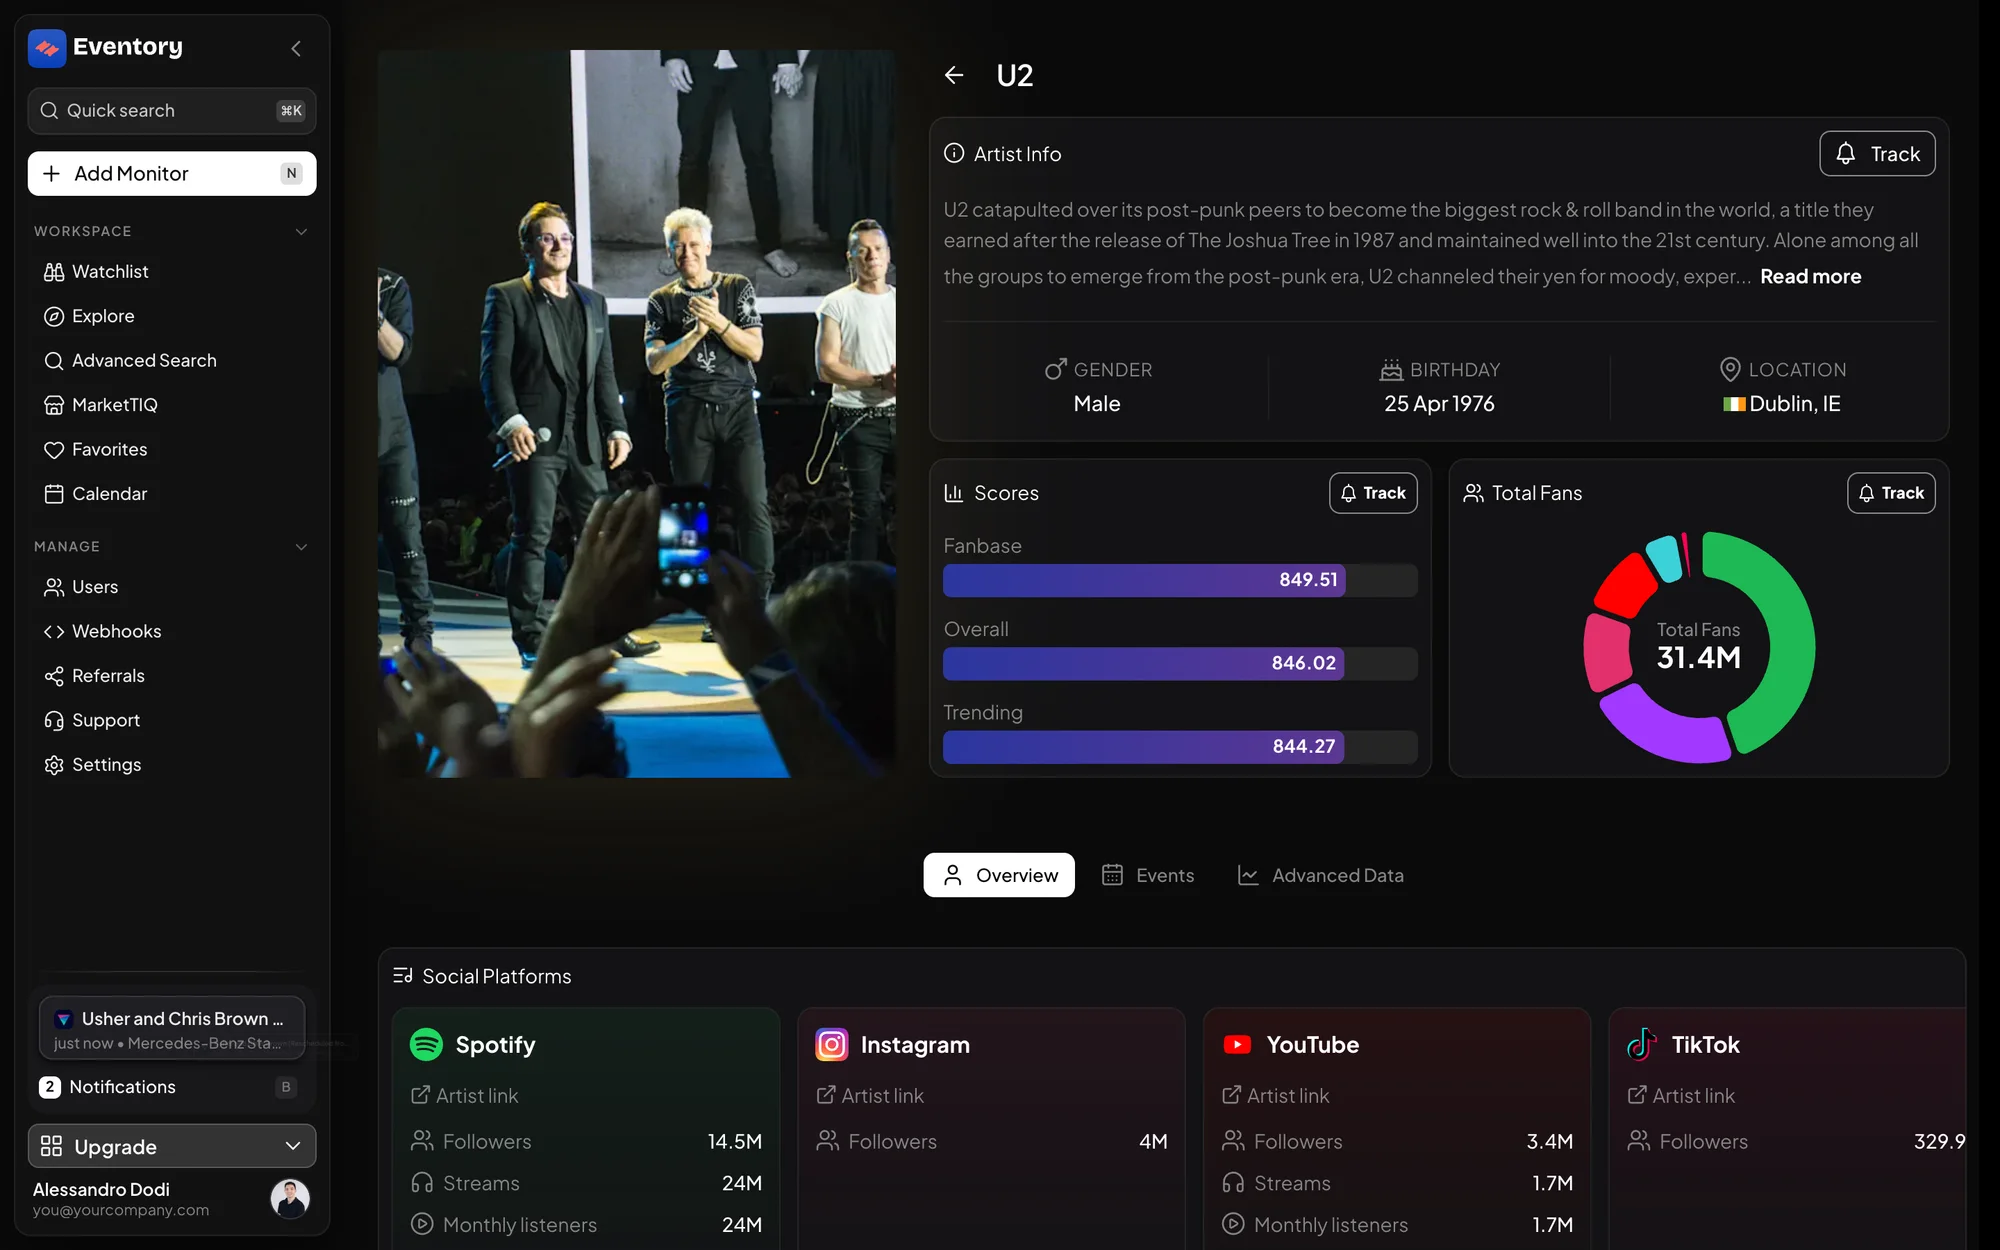
An artist page: Artist Info, the Scores card with fanbase, overall and trending, Total Fans across platforms, and the Overview, Events and Advanced Data tabs. Read the artist scores and demographics
The Scores card summarises the audience: Fanbase, Overall and Trending, each out of a thousand, and Total Fans adds the platforms up with a ring per platform. They are the same values a Tracker can watch, so a rule like trending score above a value can be set from what you see here.
Demographics shows the top age bracket and top country of the audience, which is the quickest check that an event in a given city has the fans to fill it. The advanced section is where Market Intelligence applies; it is shown locked otherwise.
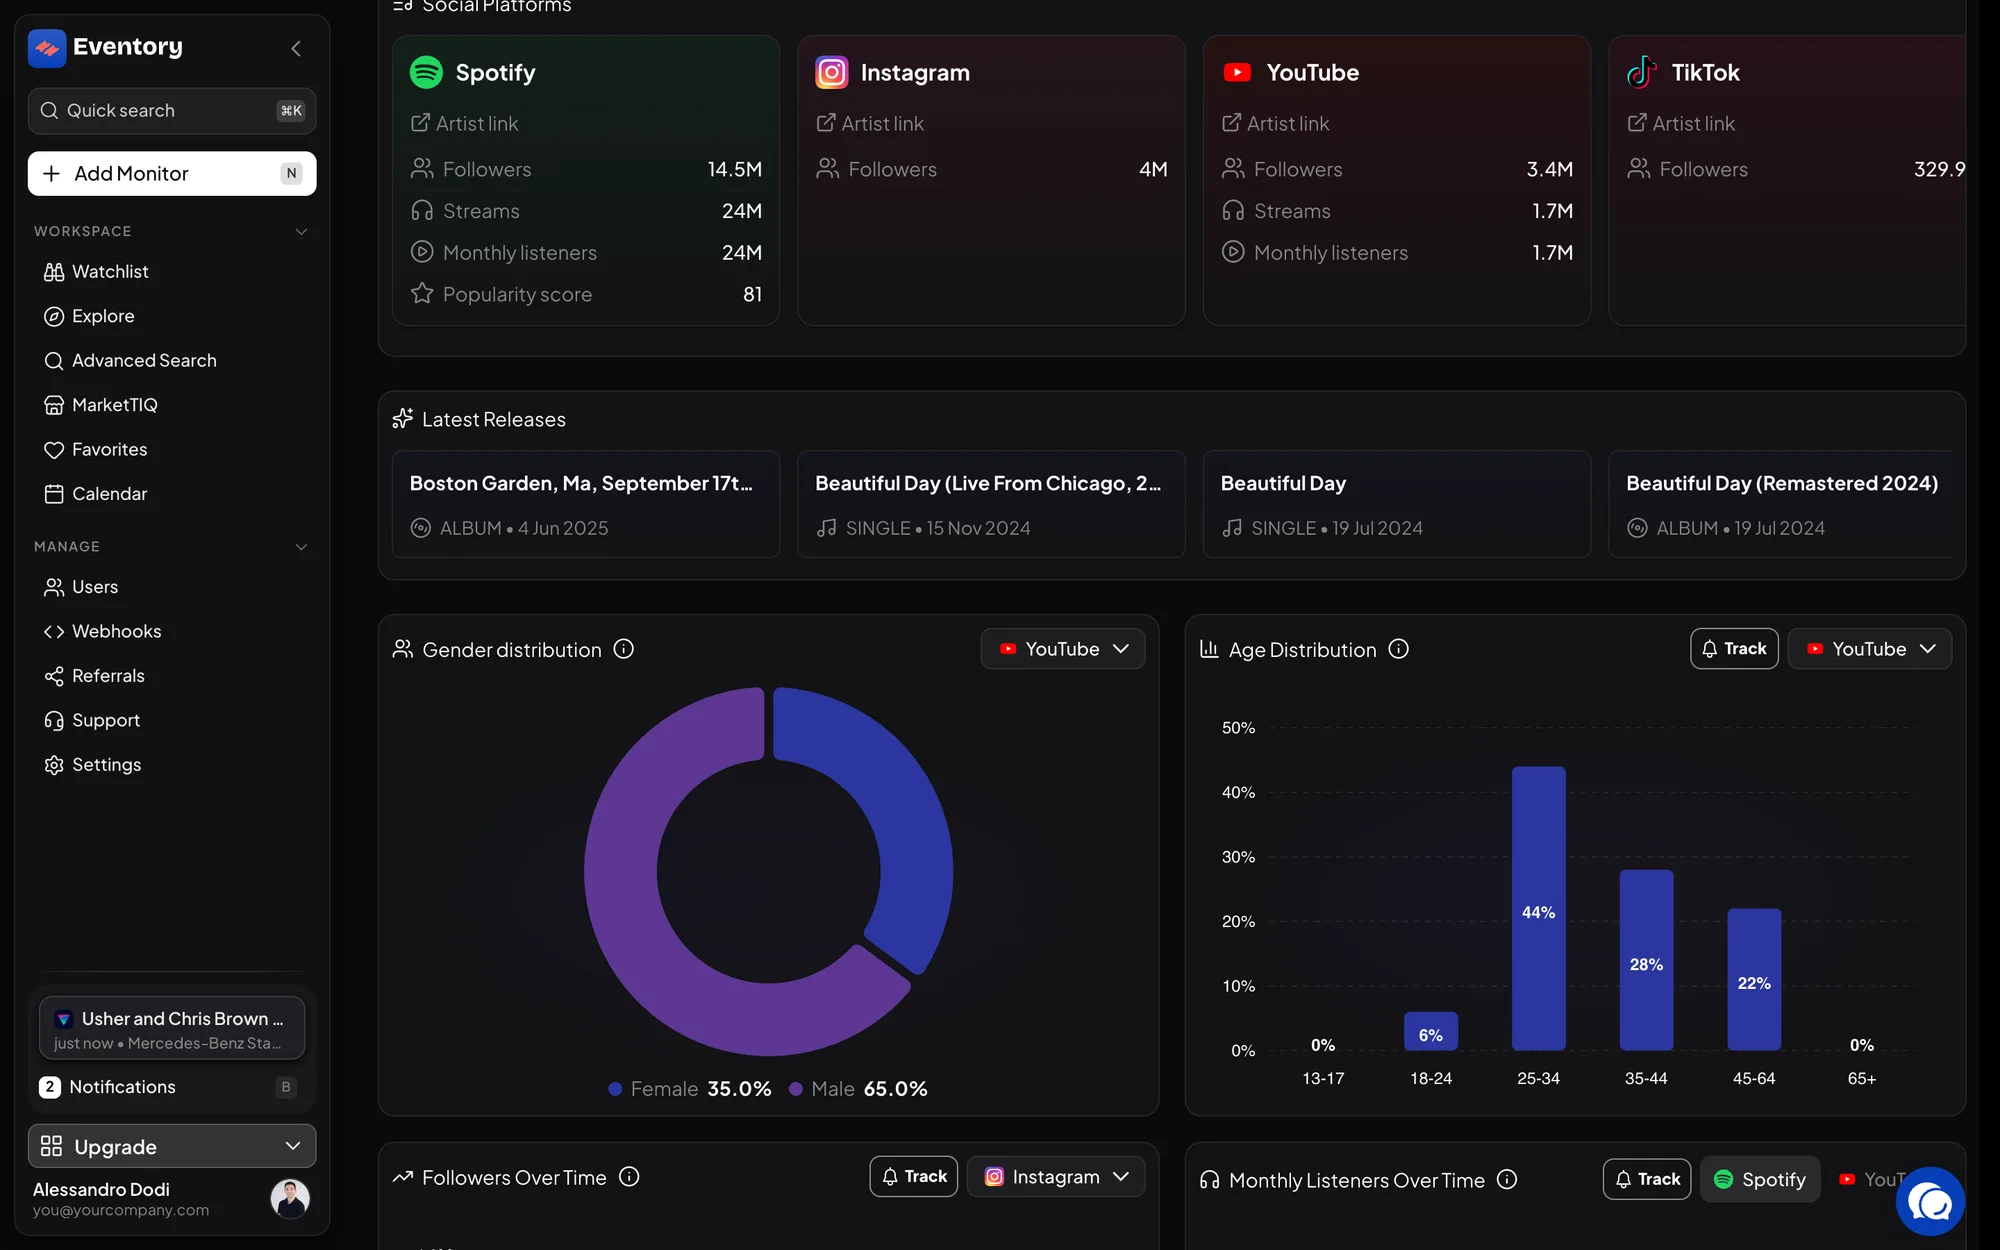
Further down the artist page: the Social Platforms cards, Latest Releases, Gender distribution and Age Distribution. Read the artist's events
The Social Platforms cards carry Followers, Streams, Monthly listeners and the Popularity score per platform, with a link to each profile. Below them, Gender distribution and Age Distribution describe the audience, and Followers Over Time and Monthly Listeners Over Time chart its growth, each with a Track button to put a Tracker on it. The Events tab lists upcoming and past events with their sales, with a search box to find one date in a long tour; comparing dates on the same tour is the fastest way to see which city is the strong one.
Open a venue page
Click the venue's name on an event page. Under the Location map are the four headline cards: Capacity, Events (last 12 months) with how many had resale sales, Resale tickets per event and Resale rate. The Seat map card shows the layout, and Events at this Venue lists what is coming with a search box.
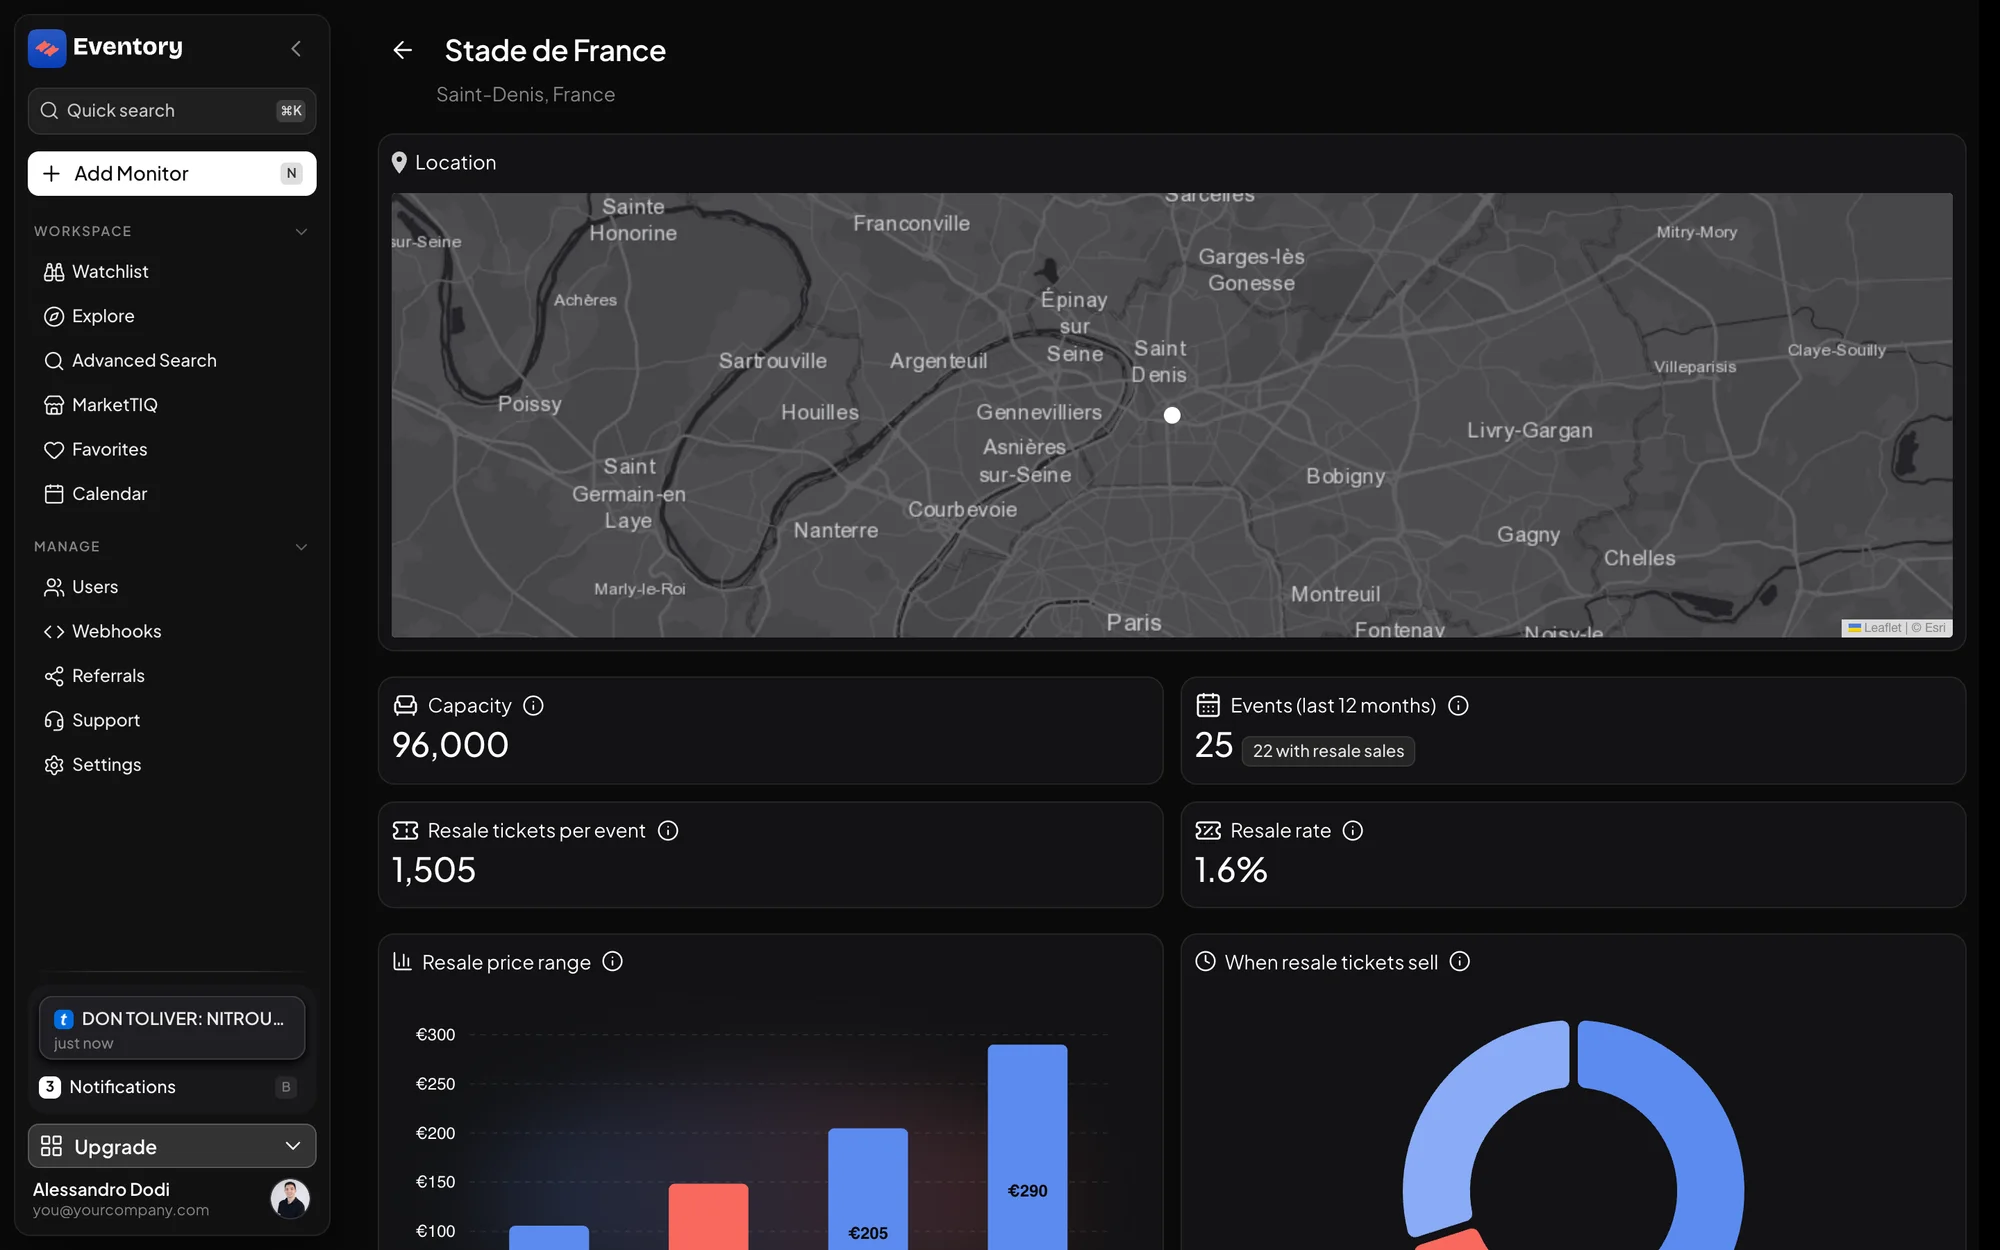
A venue page: the Location map and the four headline cards, Capacity, Events (last 12 months), Resale tickets per event and Resale rate. Read the resale insights
The insights are the venue's history on the resale market across the events it hosted in the last 12 months. Resale price range shows the 25th percentile, the median, the 75th and the 90th. When resale tickets sell splits the sales into 30+ days before the event, 7-30 days before and the last 7 days, which is the venue telling you whether its tickets move early or late.
Top sections ranks the sections by resale tickets with their median price and share, which is the venue telling you where its demand is before you set a section filter on a monitor. A venue with no resale history yet says so rather than showing empty charts.
- Resale rate: the share of the venue's tickets that reach resale.
- Resale price range: 25th percentile, median, 75th and 90th.
- When resale tickets sell: 30+ days before, 7-30 days before, last 7 days.
- Top sections: tickets, median price and share per section.
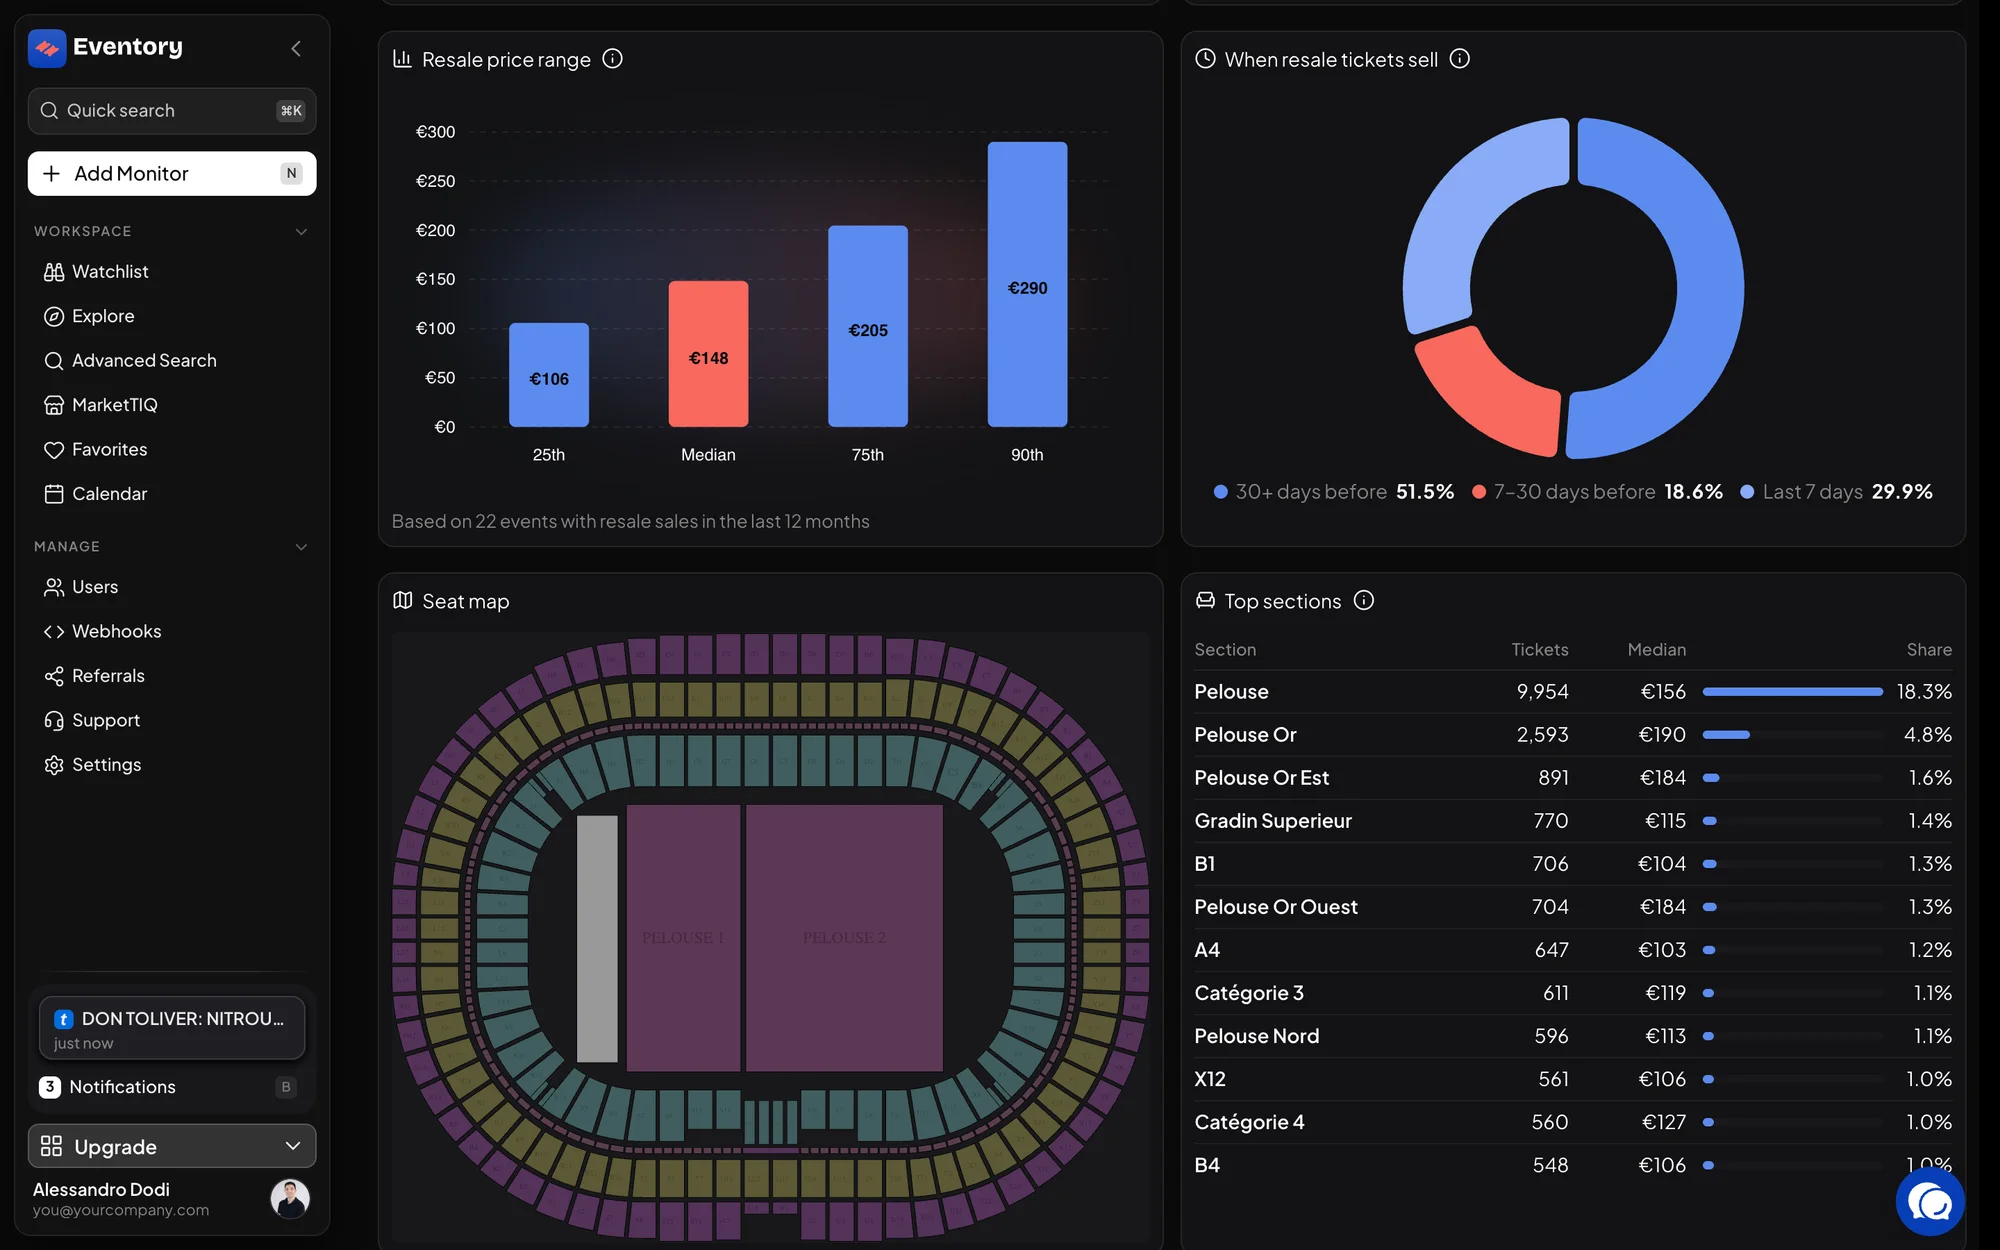
The venue's resale insights: Resale price range by percentile, When resale tickets sell, the Seat map and Top sections with tickets, median and share.
How to use the two pages together
The artist page tells you whether there is demand; the venue page tells you how that demand behaves in the room. An artist with a growing audience in a venue whose floor always resells is the combination worth monitoring, and both pages have a Track button to start.
The venue's Top sections and the artist's events table are also the input to filtering a monitor: a section filter is only as good as your knowledge of which sections matter.
Where the data comes from
Artist figures are collected snapshots of the platforms, refreshed regularly, so a number can trail the platform by a little. Venue statistics are computed from Eventory's own sales data over the past year, nightly.
A venue page without a seat map is a venue Eventory has no map for; the rest of the page still works.
Frequently asked questions
Why is part of the artist page locked?
The advanced artist data belongs to Market Intelligence. The platforms, releases and events are open to everyone.
Can I monitor an artist instead of an event?
Yes. Track on the artist page creates a discovery monitor that adds the artist's events as they appear. See Discovery monitors.
Why does a venue say Not enough resale data yet?
Its events have not sold enough on resale in the last 12 months to compute the insights. The seat map and the events list still show.
Are these pages indexed by search engines?
Yes. Artist, venue and event pages are public and linked from the sitemap.
Next steps
- Read an event page
- Watch an artist or venue with a discovery monitor
- Create a Tracker on an event or artist
- Find events with advanced search
Browse the events
Sales, prices and availability for the events on sale right now.
API documentation: the reference for developers, next to these guides.