Market data
Read an event page
An Eventory event page gathers what one event is doing across markets. The StubHub & Viagogo tab shows resale sales, listings and prices with their history; the Ticketmaster tab shows primary inventory and prices by section; Vividseats, Artist and Venue tabs add their own data; and Advanced Data lists every metric as a table. The page is public, signed-in users see more of it, and the full sales history is part of Market Intelligence.
Before you start
- Nothing to read the public parts. Sign in to unlock more of each tab.
- Market Intelligence for the full sales history and the gated metrics.
Steps
Open the event
Find the event with the search bar at the top of the app, through Discover, or from a notification. The page header shows the artist, the date and the countdown to the event, the venue on a map, and Buy buttons for the marketplaces it is listed on. Track opens the monitor flow for this event, Save puts it in your favorites.
Under the header, the tabs select the data source. The page opens on the resale tab, or on Ticketmaster when you arrived from a Ticketmaster link.
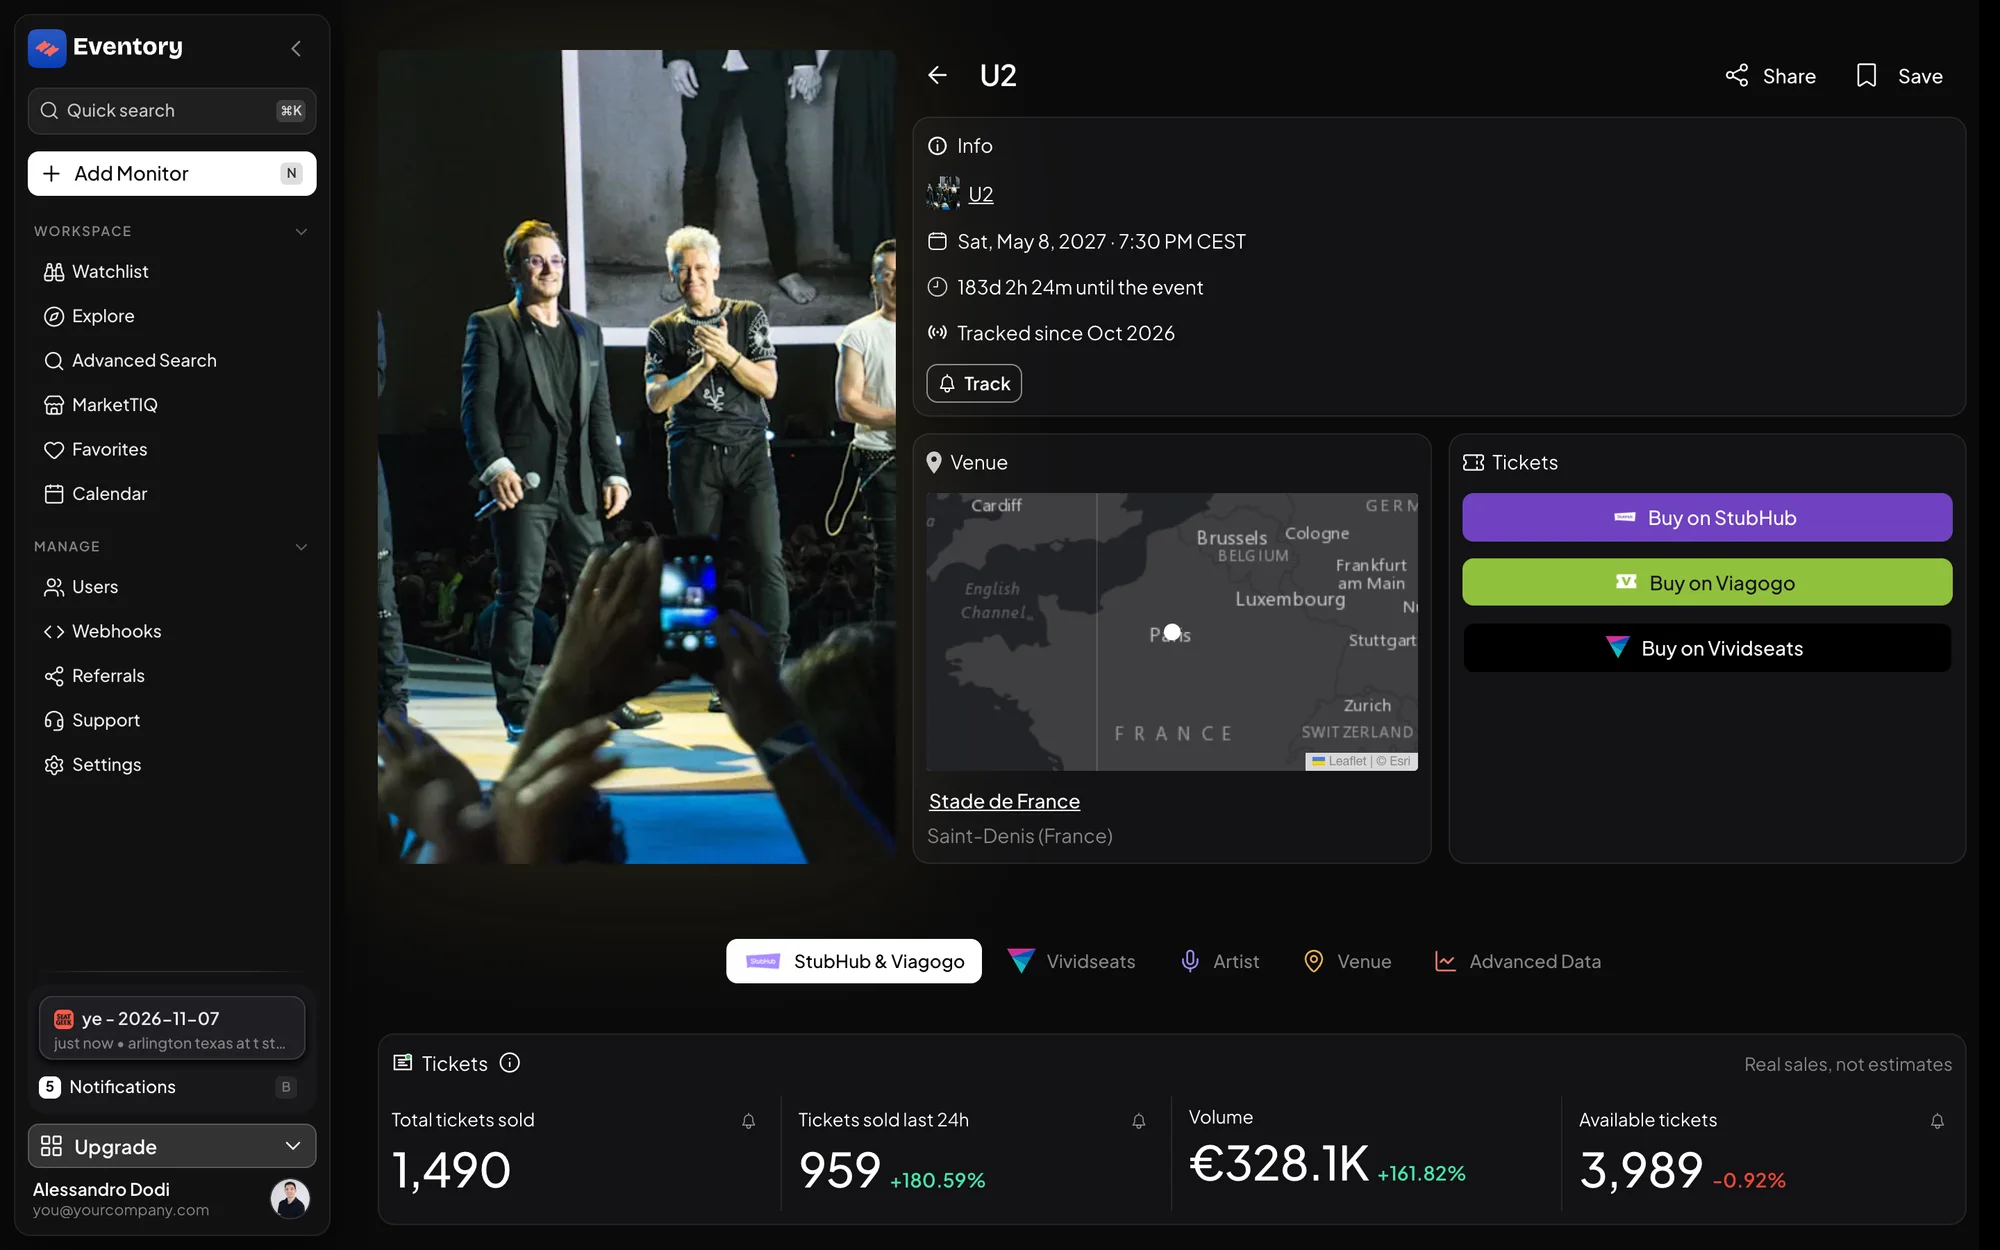
The event header with Track, Share and Save, the marketplace buttons, the source tabs and the first Tickets cards of the StubHub & Viagogo tab. Read the resale tab: StubHub & Viagogo
The KPI cards answer the first questions: how much has sold, how much is still listed, and at what prices. Every figure has a 24-hour counterpart, so you can separate what the event has done over its life from what it did yesterday.
Below the cards are the charts and the sales table. The latest sales are open to everyone; the full history, every sale since the event went on sale, is the Market Intelligence part of the page.
- Tickets: Total tickets sold, Tickets sold last 24h with its change, Volume and Available tickets.
- Prices: Avg sale price, Avg listing price, Get in price and Highest sale price.
- Sales-to-available ratio, the quickest read of pressure on an event, in Advanced Data.
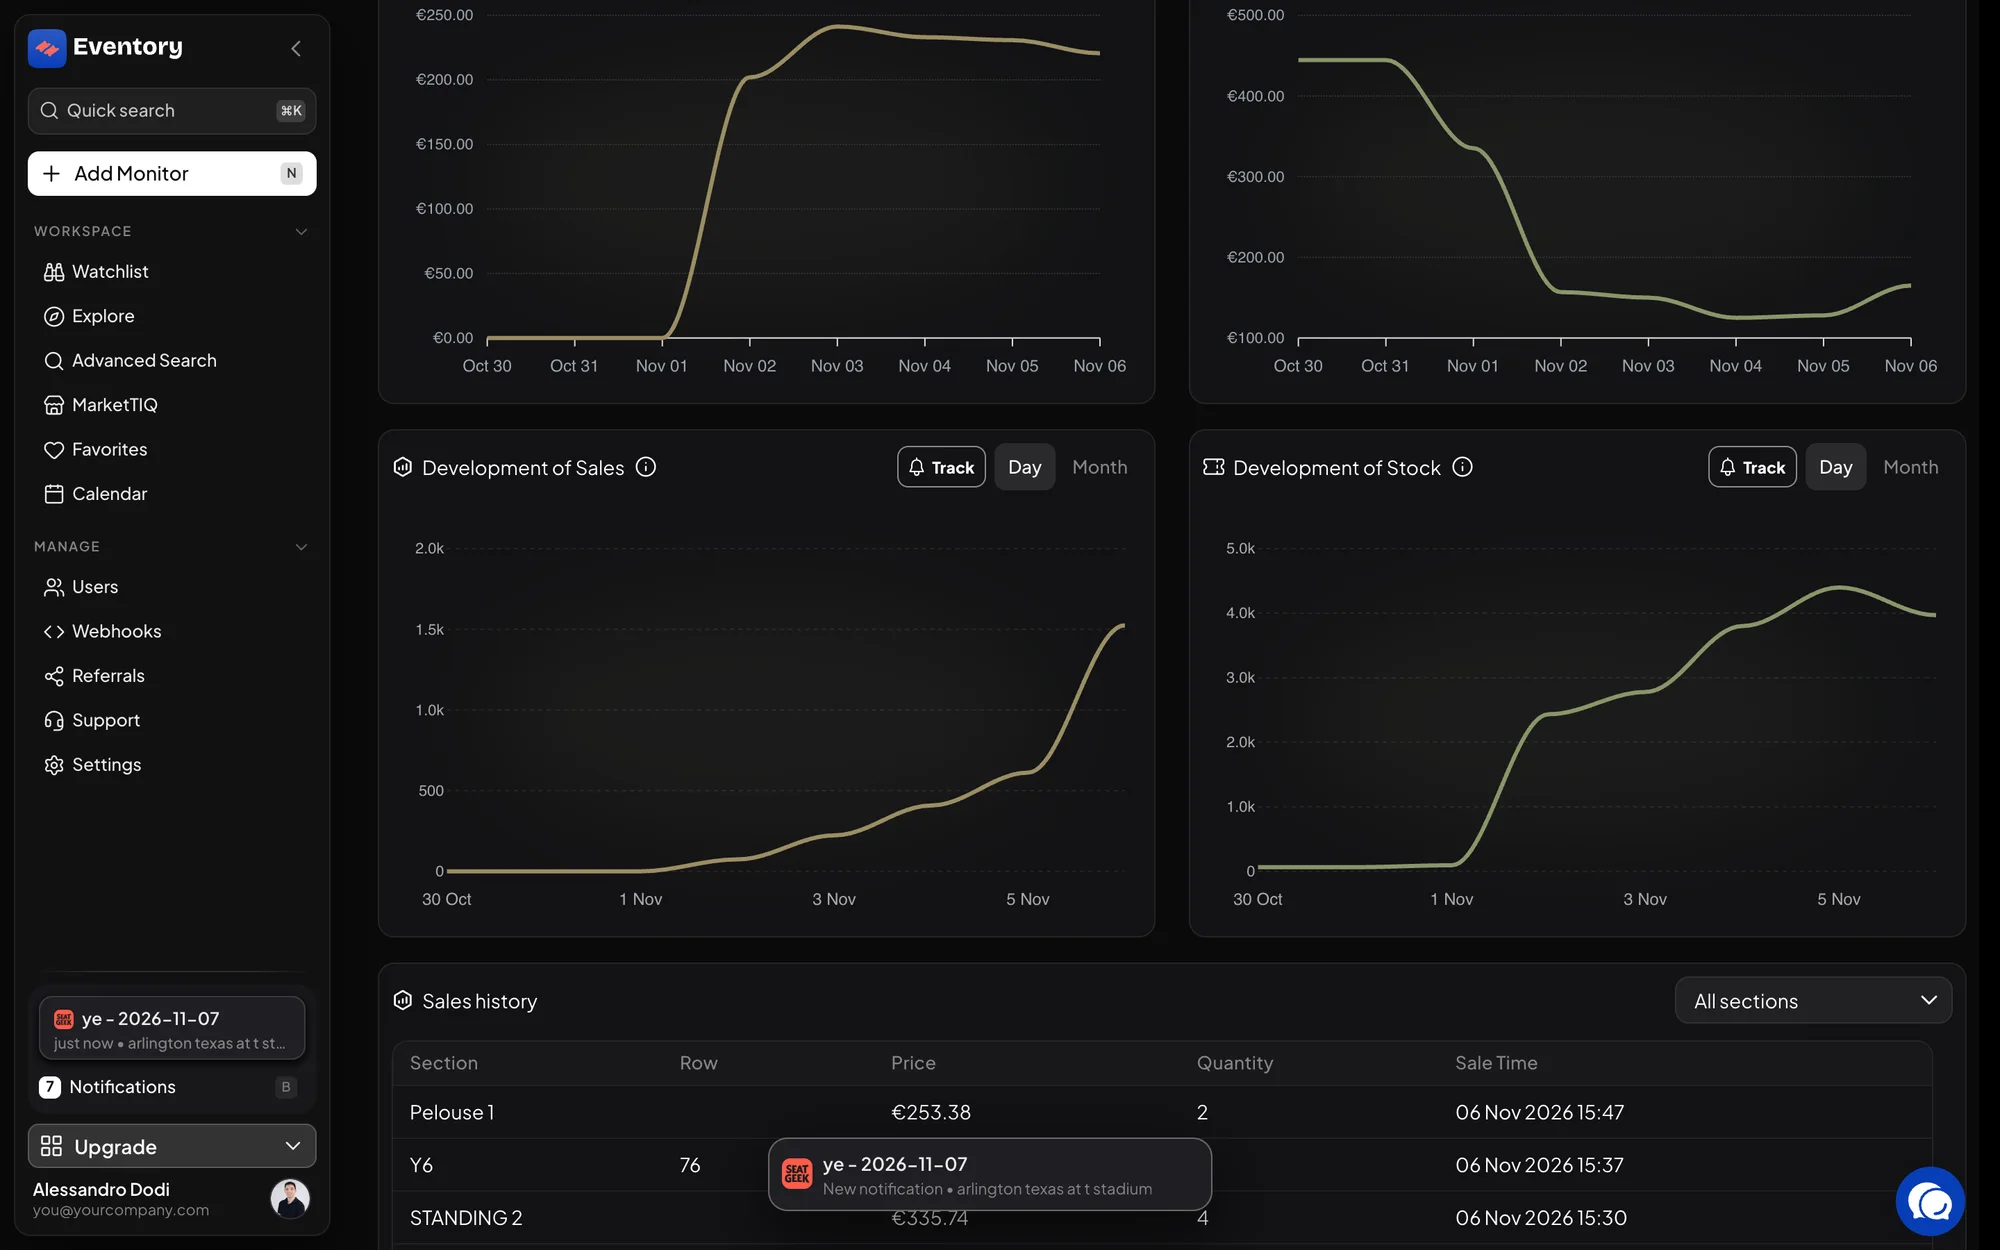
Further down the resale tab: Development of Sales, Development of Stock and the Sales history table with section, row, price, quantity and time. Read the charts
Daily sales is the shape of the event: steady sell-through, a spike at a release, a lull before a price cut. Avg. Ticket price (sold) and Get In Price plot the two prices over time, and Development of Sales and Development of Stock put the cumulative sales against the tickets available. Sales history, at the bottom, is the table of individual sales with section, row, price, quantity and time.
Tickets per price range (sold) is the histogram: how sales are distributed across price points, which tells you where the market is thick and where a listing would stand alone. Each chart card has a Track button that opens a Tracker on that metric, and a Day or Month switch for the grain.
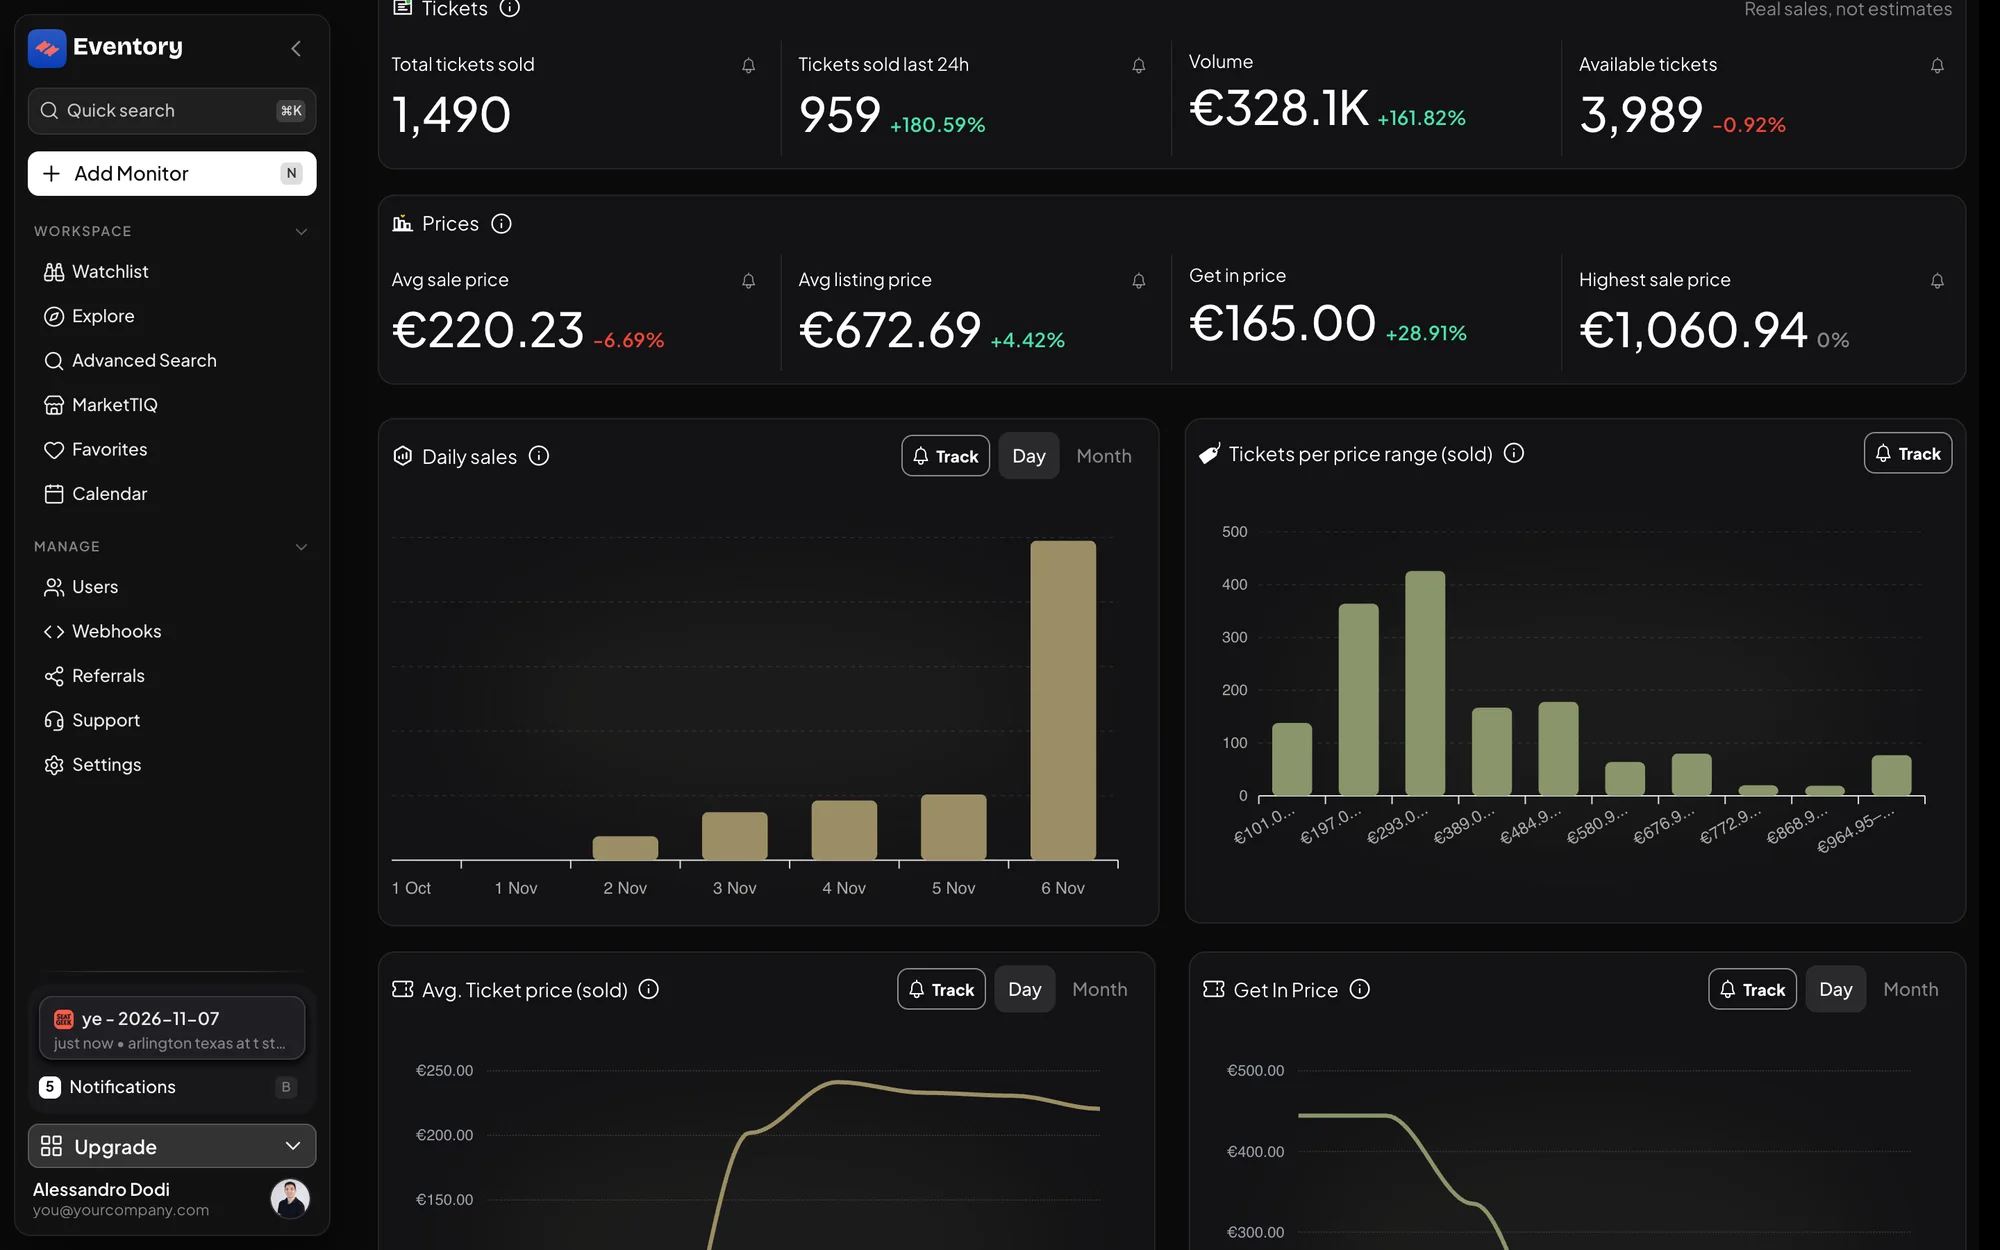
The Tickets and Prices cards, then the charts: Daily sales, Tickets per price range (sold), Avg. Ticket price (sold) and Get In Price, each with Track and a Day or Month switch. Read the Ticketmaster tab
Where the event is on Ticketmaster, this tab shows the primary market: available stock from the latest scrape, tickets sold, and the standard, resale and platinum average prices. The section view breaks availability and price down by section of the venue, with the venue map where one exists.
The stock and sales over time chart here is the primary-market mirror of the resale chart: how fast the venue is emptying and at what price the box office is doing it.
Vividseats, Artist and Venue
The Vividseats tab appears when the event is listed there and shows listed inventory, price points, median and get-in price, and how each moved in 24 hours. Artist shows the social and streaming metrics behind the demand: Spotify followers and monthly listeners, Instagram, TikTok and YouTube, and Eventory's scores. Venue shows the venue's statistics across the events it has hosted.
These tabs are only shown when the data exists, so a page with fewer tabs is not broken: that event simply is not on those sources.
Advanced Data: every metric as a table
The last tab lists every figure the page knows about as labelled rows, grouped by market: resale, primary and artist. It is the tab to use when you want a number rather than a chart, or when you want to check exactly which metric a Tracker rule is reading.
Metrics that need Market Intelligence are shown locked rather than hidden, so you can see what a plan would add before you buy it.
What is open, what needs sign-in, what needs a plan
The page is built in layers. Anyone can see the event and its headline numbers. Signing in opens more of the resale tab. Market Intelligence opens the full sales history and the locked metrics in Advanced Data.
Locked content is shown blurred, with a prompt, rather than removed, so the page tells you what exists. The numbers under a blur are placeholders, not real data: what you see once unlocked will differ.
From reading to acting
The page is also the fastest way to start watching an event. Track in the Info card opens Add Monitor with the event filled in, and each chart card's Track button opens a Tracker on the metric it shows.
The marketplace links in the header open the event on StubHub, viagogo, Ticketmaster or Vivid Seats, so checking a listing against the chart is one click.
When a page says it is preparing
A newly added event shows a preparing state on the resale tab until the first data has been collected. That can take a little while after an event is first tracked; the Ticketmaster tab, if present, usually fills first.
If a page stays in that state for days, the event is probably a duplicate of one that already has data. Search for the event by name and use the page that has the charts.
Frequently asked questions
Why do I see the last sales but not the whole history?
The latest sales are open to every signed-in user. The full history, from the first sale on, is part of Market Intelligence.
Which marketplaces does an event page cover?
StubHub and viagogo for resale, Ticketmaster for the primary market, and Vivid Seats where the event is listed there. Artist and venue data come from Eventory's own collection.
How often are the numbers updated?
Continuously for the resale market, in scrape runs for Ticketmaster, and daily for the statistics history. The 24-hour figures tell you how fresh the movement is.
Can I get this data outside the page?
Yes, through the API: the same event, sales, price and availability data behind an API key, billed in credits. See the API documentation.
Next steps
- Find events with advanced search
- Find the biggest movers with MarketTIQ
- Create a Tracker on an event or artist
- Add a monitor to an event
Get the full market data
Every sale, every price move and the sale calendar, for research and pricing.
API documentation: the reference for developers, next to these guides.