Monitors
Find and manage your monitors
The Watchlist at /monitor is the table of every monitor in your workspace. Search finds an event by name, the filter bar narrows by website, region, status, monitoring method, delivery and event date, and the header menu sorts by name, date added, event date, seat quantity or website. Rows can be paused, muted for a while, edited one at a time or in bulk, and deleted when the event is over.
Before you start
- Monitors in your workspace. A shared workspace shows your colleagues' rows too.
Steps
Find a monitor
Use the search box in the toolbar for an event by name. It is the fastest path when you know what you are looking for and the quickest way to check whether you already monitor something before adding it twice.
For a set of rows rather than one, use the filter chips under the search box: Status, Website, Region, Type, Event date, Method and Delivery. Each opens a list of values, any of which can be ticked.
- Status: Active or Paused.
- Muted, Unmuted, or Active and muted.
- Method: the monitoring method the row uses.
- Delivery: including Unknown delivery, which finds rows pointing nowhere useful.
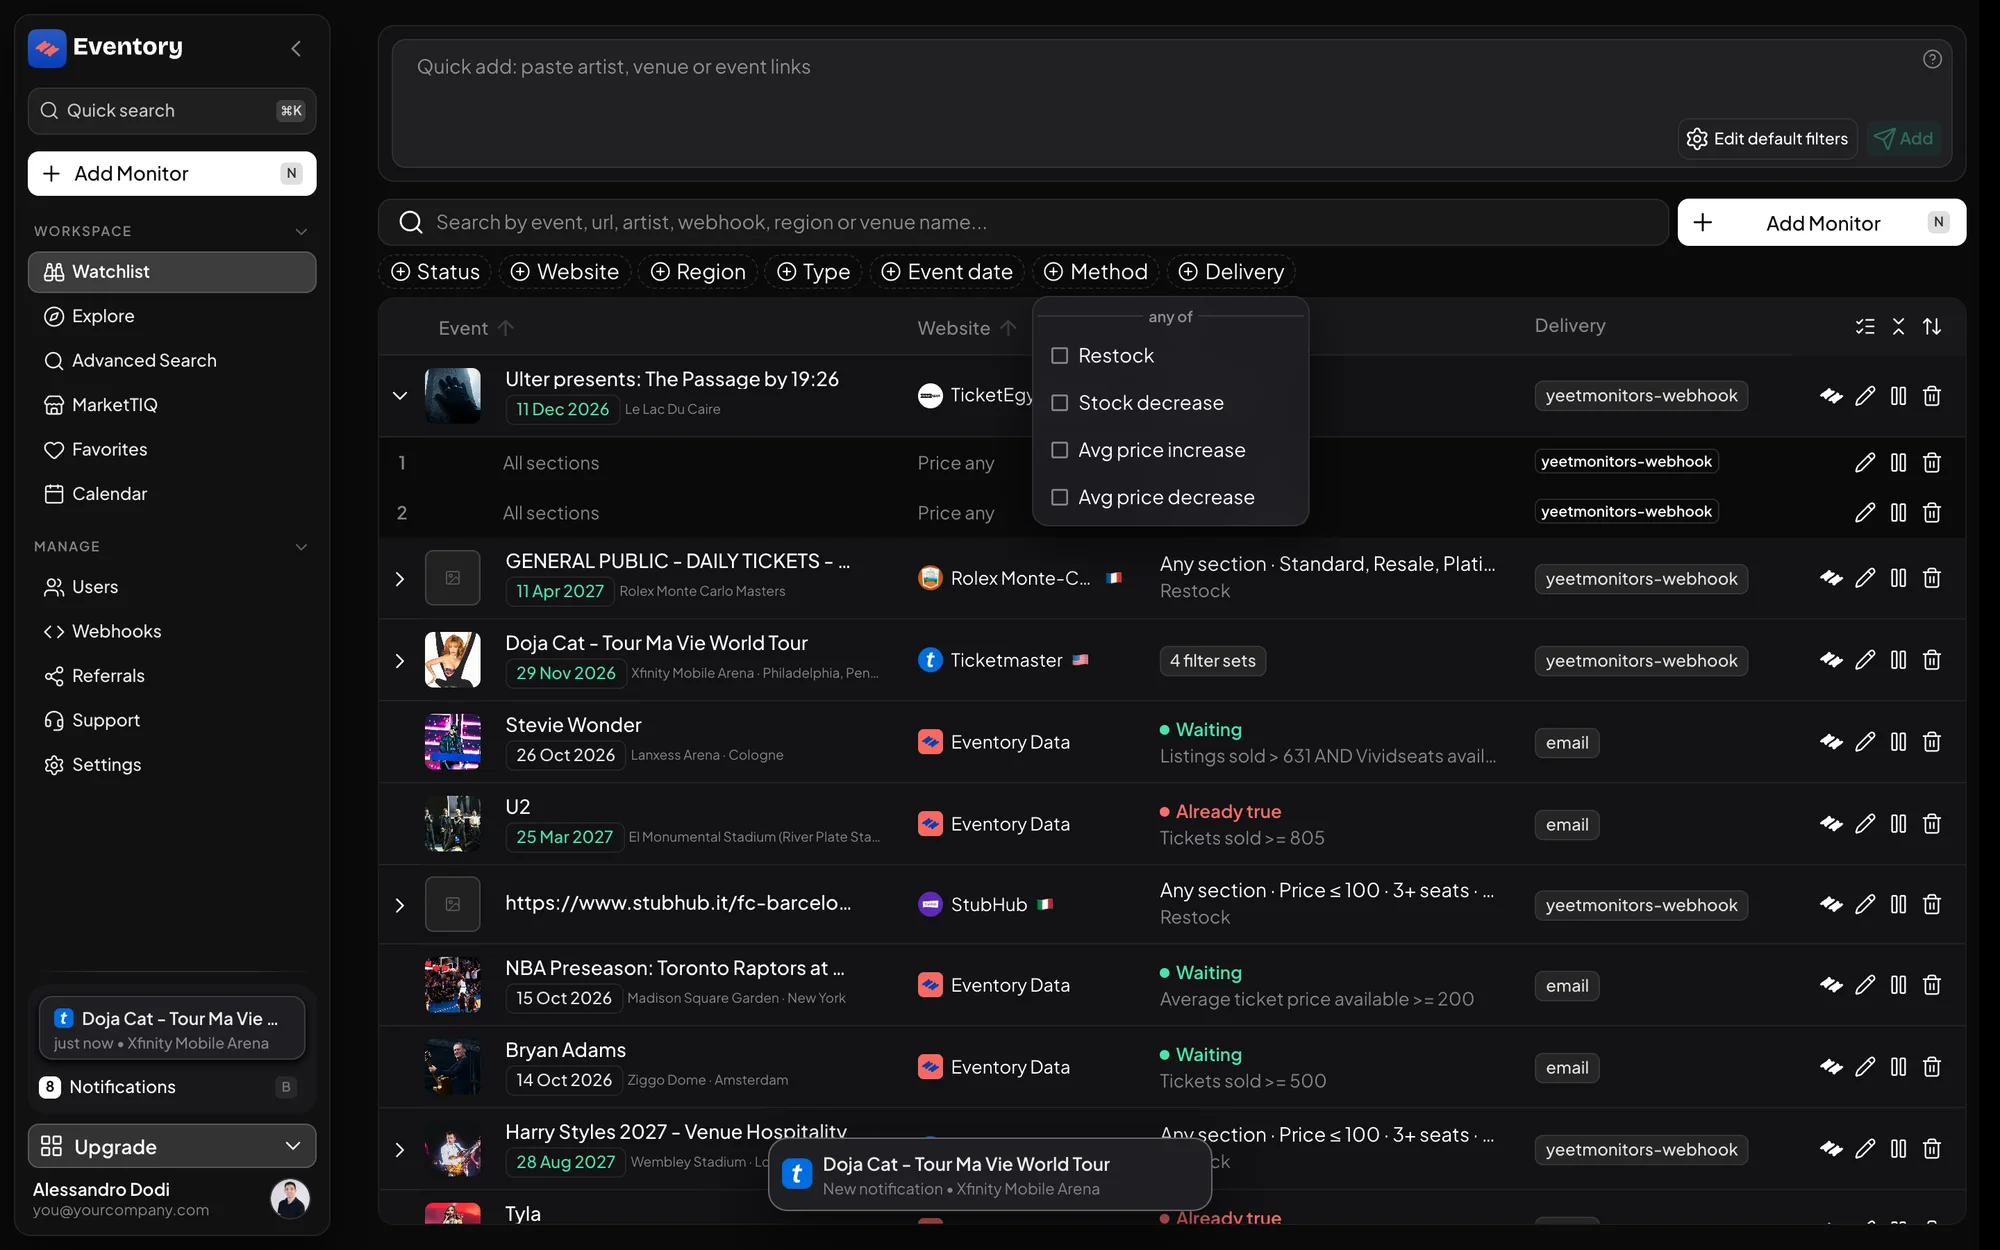
The filter chips under the search box; Method is open, with any of its values tickable. Sort the table
Sorting is the arrows icon at the right end of the table header, and the Event and Website headers can be clicked directly. A fresh Watchlist is sorted by Newest, so your last addition is on top. The two icons beside it switch selection mode on, for bulk actions, and collapse every expanded row.
The ten sorts cover the questions you actually ask of a Watchlist: what did I add recently, what happens soonest, where is the big seat quantity.
- Event name A-Z or Z-A.
- Newest or Oldest, by when the monitor was added.
- Date, earliest or latest, by when the event happens.
- Seat quantity, low to high or high to low.
- Website name A-Z or Z-A.
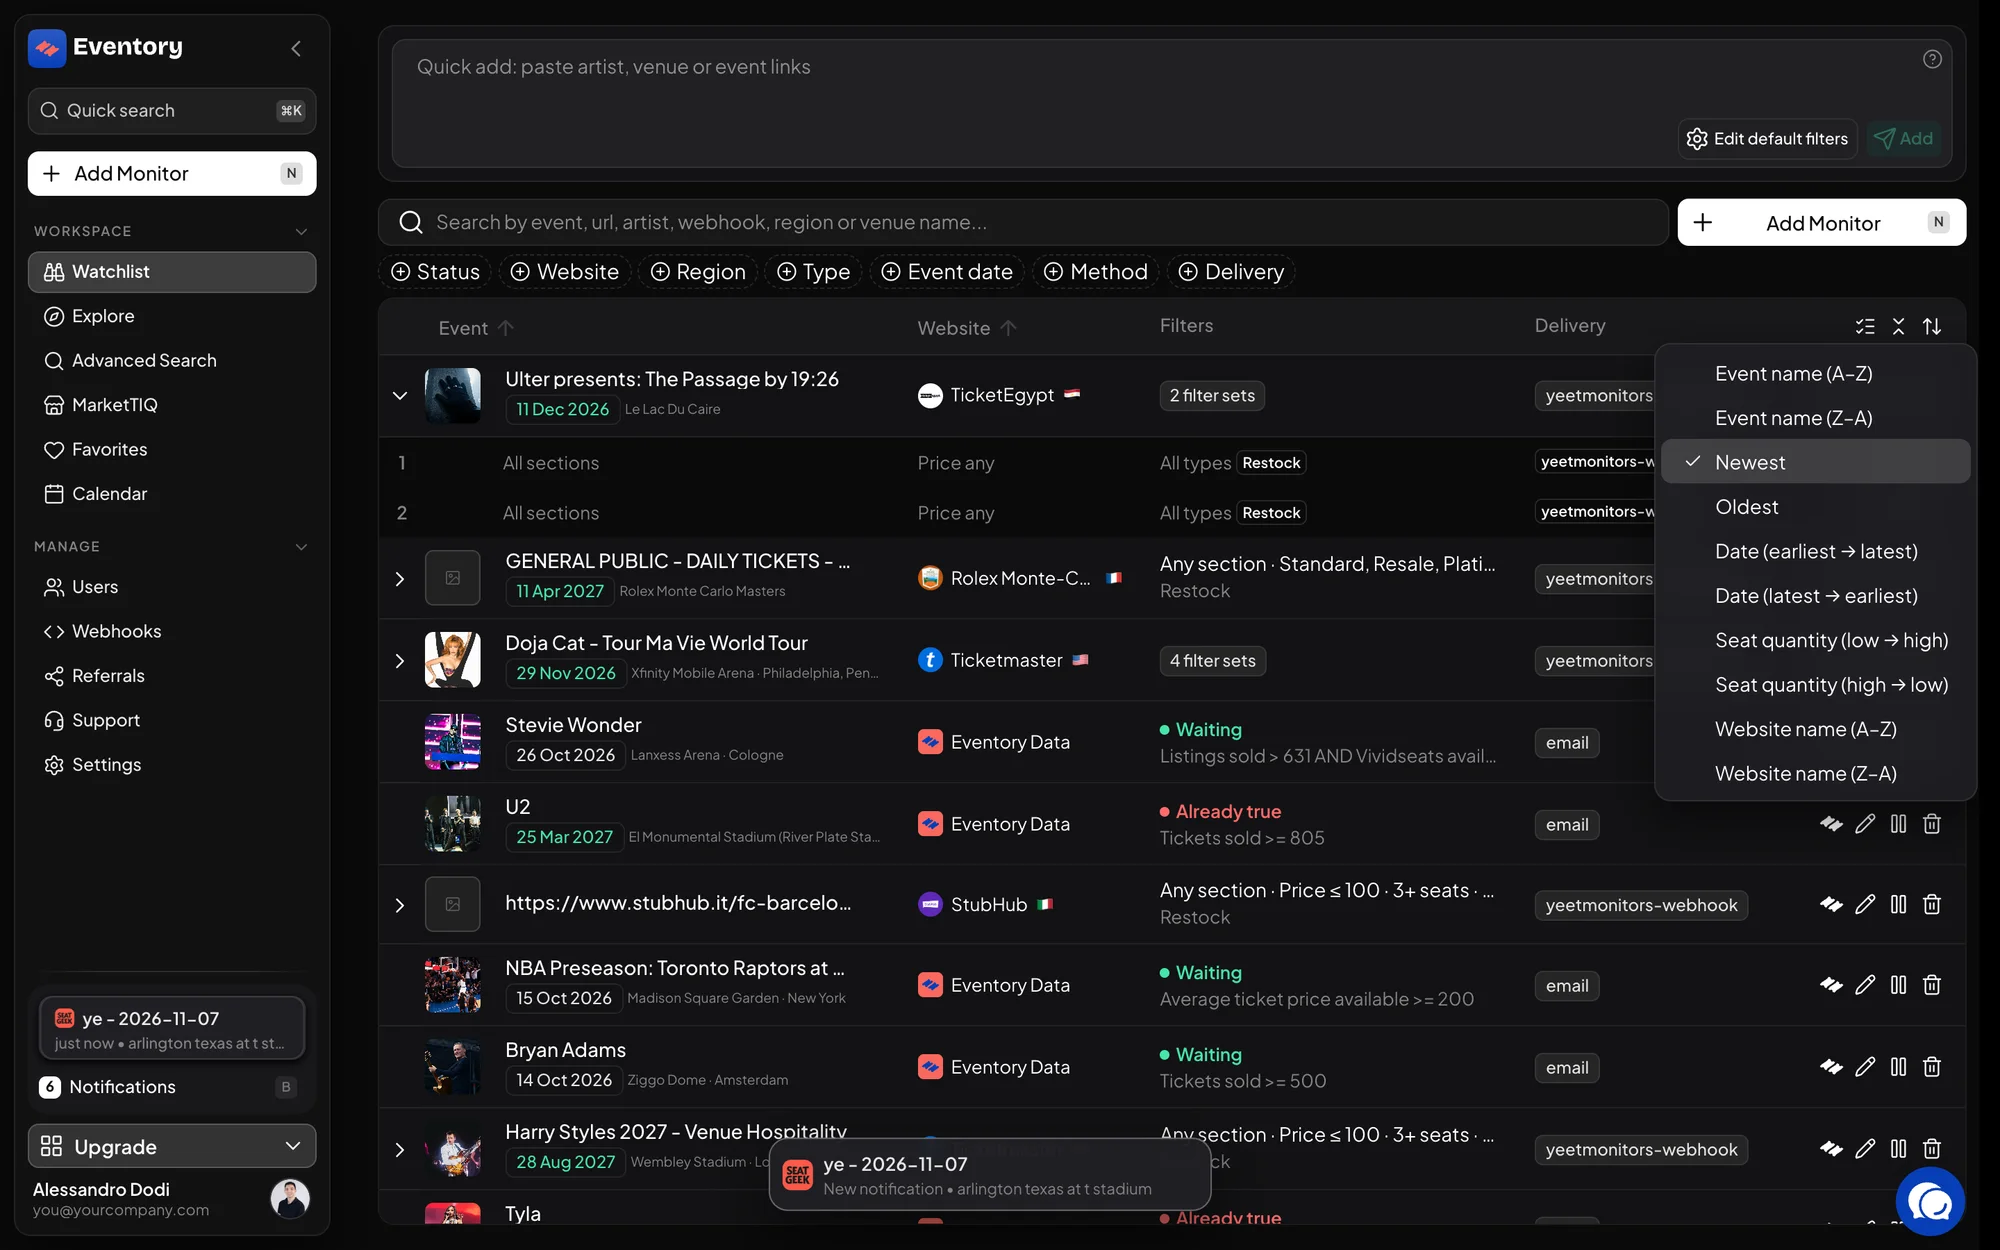
The sort menu from the header icon: event name, Newest and Oldest, event date, seat quantity and website name. Read a row
Each row carries the event with its date and venue, the website with its region flag, a one-line summary of its filters and its delivery. The filter summary is the part worth learning to read: it states the method, the sections, the price band and the thresholds in a single line, so you can audit a page of monitors without opening anything. Tracker rows show their rule and its state instead: Waiting, or Already true.
A row with several filter sets can be expanded to show one line per set, each with its own edit, pause and delete actions. Copy event link copies the link to the event the monitor watches.
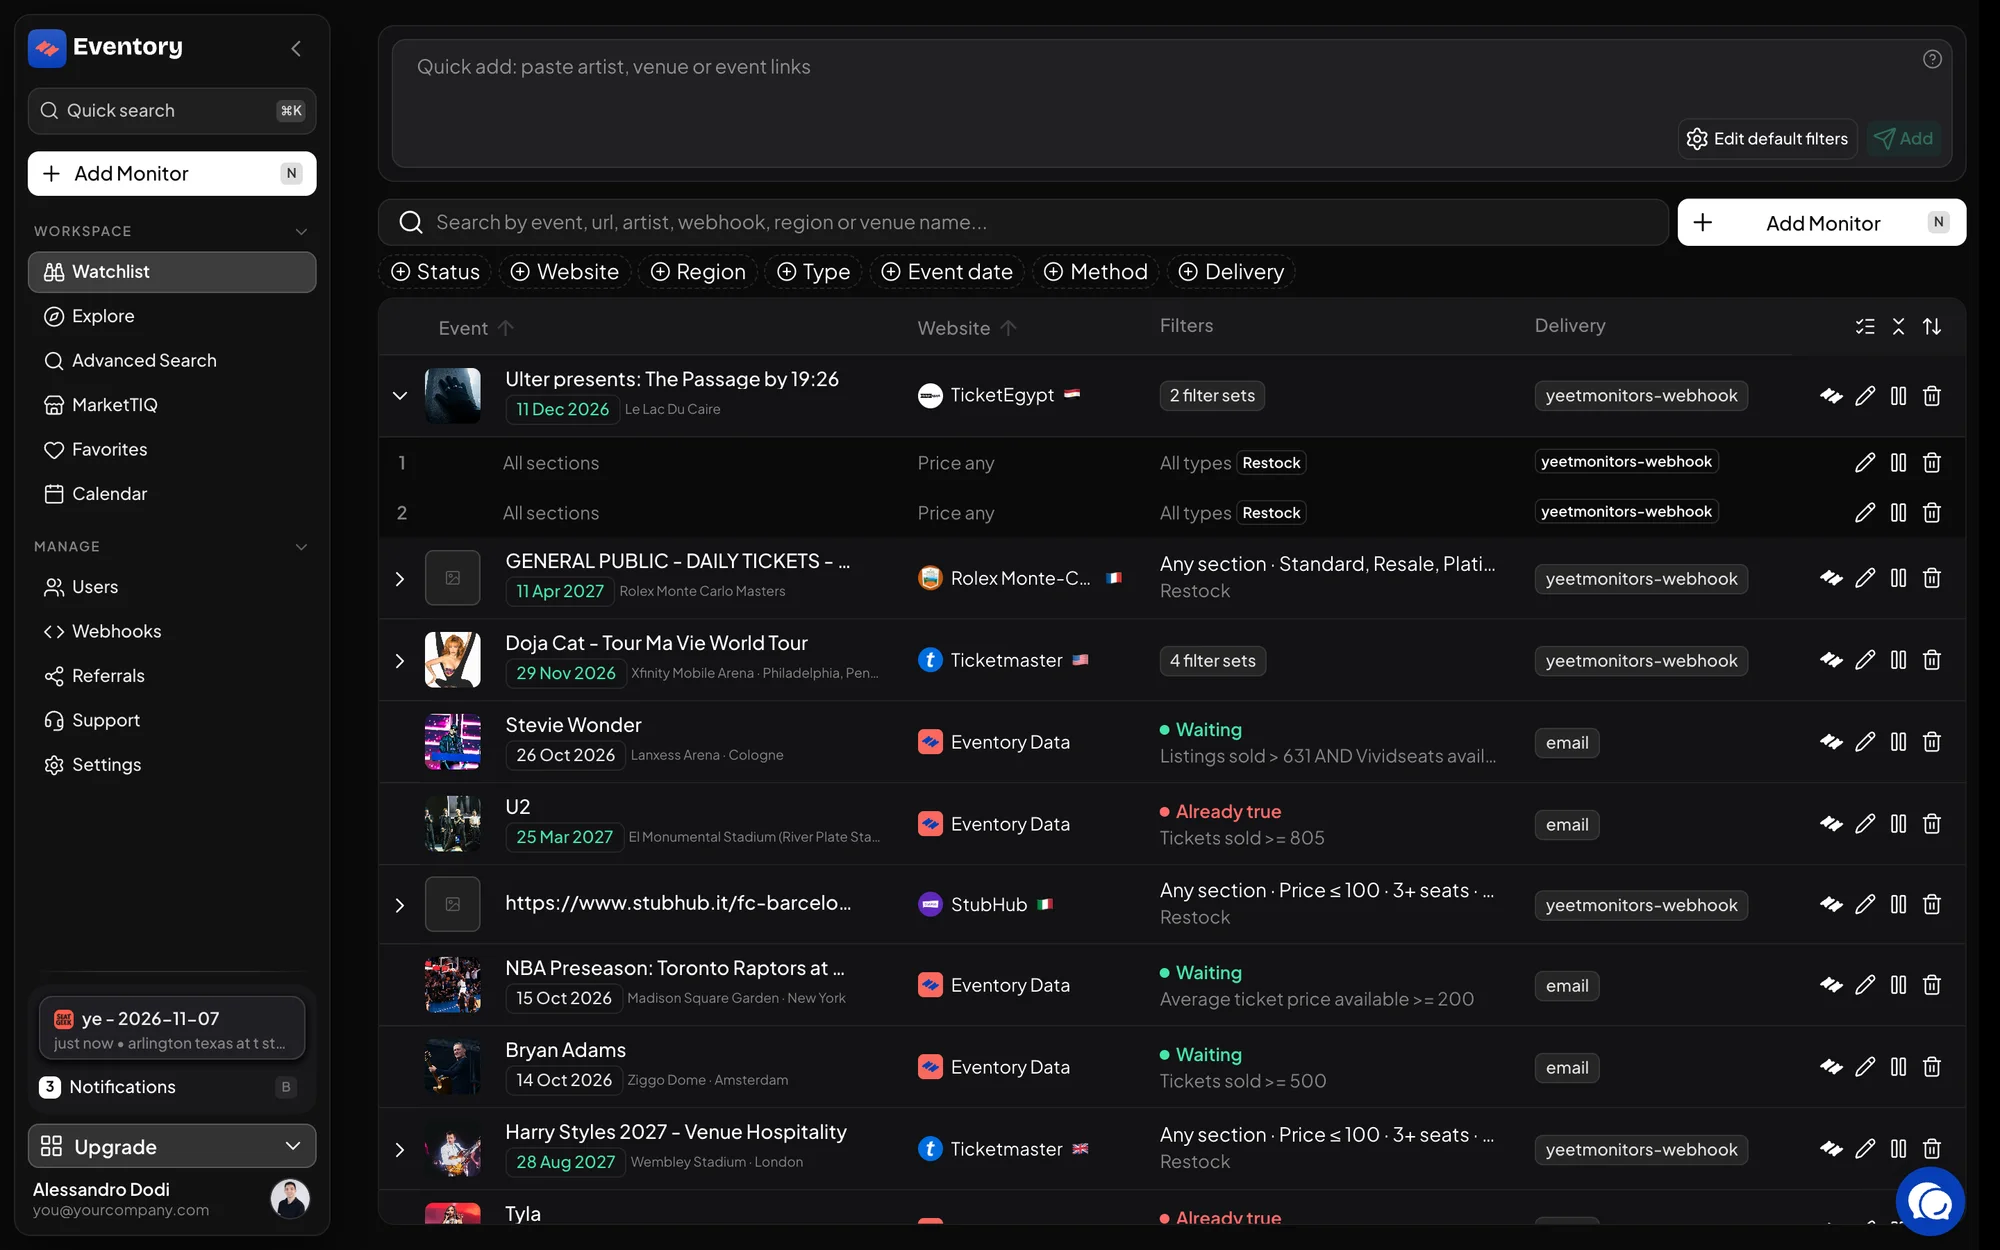
A page of monitors: the filter summary column reads the method, sections, price band and seats of each row at a glance. Pause, mute or delete
Pause stops a monitor from producing alerts and keeps every rule. Mute silences a row for a chosen stretch of time and then lets it come back on its own, which is what you want during an on-sale you are already watching by hand.
Delete removes the monitor and frees the event against your plan limit. Filtering by Event date and deleting what is past is the usual way to keep the table honest.
- Pause: indefinite, until you resume it.
- Mute: for a set period, after which alerts resume by themselves.
- Delete: permanent, and the stream stops within about a minute.
Edit many monitors at once
Select rows and open the bulk edit dialog to change one field across all of them: delivery, roles, keywords, sections, ticket types, priority, the price filters, the stock thresholds or the monitoring method.
The dialog only offers fields every selected row can accept, so a mixed selection offers fewer fields rather than silently dropping changes. For list-like fields there is an option to add to existing values instead of overwriting them, which is how you add one Discord role without wiping the others.
Note: Bulk edits apply to every selected row. Check the selection count in the dialog title before applying, because there is no undo.
Keeping a large Watchlist readable
A Watchlist decays the same way in every workspace: events happen, monitors stay, and the page slowly fills with rows nobody reads. Half an hour a month on it is worth more than any filter tuning.
The three moves that do the work: delete past events, find rows whose delivery is unknown and either fix or drop them, and look for rows with no filters at all on busy sites, because those are the ones generating the noise everyone complains about.
Muted is not paused
Muting is time-boxed and self-healing: the row comes back on its own, which makes it safe for a situation you are handling manually right now. Pausing is indefinite and deliberate, for a monitor you want to keep but not run.
The filter bar distinguishes them, including a combined Active and muted view, because a muted row is still active and will start alerting again without anyone touching it.
Quick filter presets
A preset is a saved filter you can apply to a monitor in one click. Applying it copies the values onto the monitor, so the monitor and the preset are independent afterwards: editing one does not touch the other.
Presets are managed in Settings and are per workspace, which makes them the practical way to standardise how a team sets up monitors.
Frequently asked questions
Does pausing a monitor free up a slot on my plan?
No. The event is still on your Watchlist. Delete the row to free the slot.
Can I see who changed a monitor?
Changes to a monitor are recorded in the activity on the row, which matters in a shared workspace where several people edit the same table.
How do I find monitors whose alerts go nowhere?
Filter the Delivery column by Unknown delivery. Those are rows whose channel no longer resolves, and they are the usual explanation for alerts that seem to be missing.
Can I export the Watchlist?
The same monitors are readable through the Watchlist API, which is the right tool when you want them in a spreadsheet or your own system. See the API documentation.
Next steps
- Add a monitor to an event
- Run several filter sets on one event
- Cut down alert noise
- Read your notifications
Start monitoring
Pick a plan, add your events and let Eventory tell you the moment tickets come back.
API documentation: the reference for developers, next to these guides.